
On the map, every tree is a marker. Tap one and a details panel slides in with its story. (Missed the map tour? Start with Part 1: Getting Around the gAIa Map.)
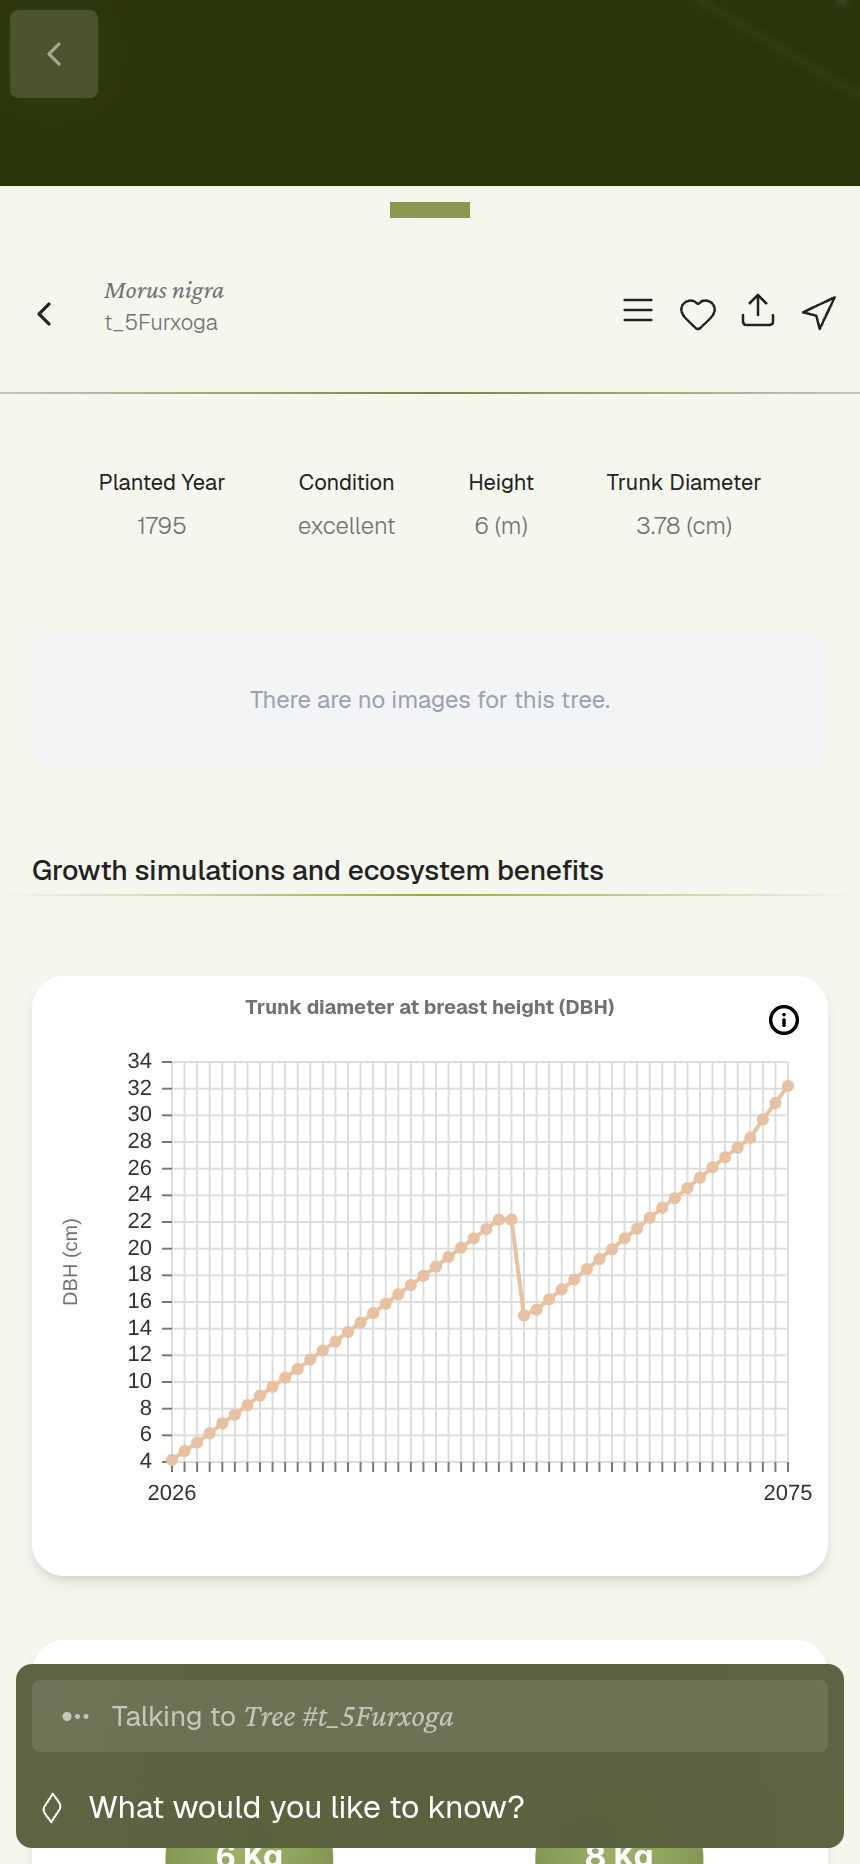
The buttons at the top
The panel header gives you a handful of quick actions:
← Back — return to the map or the previous view.
 Menu — jump straight to a section of the panel: Details, Impacts, or Conversations.
♥ Favourite — save this tree to your Favourite Trees list. A filled green heart means it's saved.
⬆ Share — copy a link or grab a QR code so you can send this tree to someone else.
➤ Directions — open walking directions to the tree in Google Maps.
If it's a tree you added yourself, you'll also get controls to edit its details.
What's inside the panel
Scroll down and you'll find:
- Details — the basics: species, height, trunk diameter (DBH, the standard way foresters measure trunk width), the year it was planted, and its current condition.
- Photos — add a photo of the tree from your device to keep its record up to date.
- Growth simulations & ecosystem benefits — charts powered by our GUS model showing the tree's impact over time: carbon stored, rainwater retained, air pollutants removed, the cooling effect of its canopy, and biodiversity.
- Advanced simulations in GUS — a link out to run deeper "what-if" scenarios.
- Previous conversations — any chats you (or others) have already had with this tree.
Single trees vs. mini-forests
Tapping a cluster or a mini-forest  opens a similar panel, but instead of one tree's figures you'll see community-wide numbers: tree count, area, density, species count, and averages like average height and trunk diameter.
Next up: Part 3: Chat and Your Collection, where we'll talk to a tree and see where your saved trees and chats live.